

The four main spans of the Huey P. Long Bridge extend nearly 2400 ft over the Mississippi River in New Orleans, Louisiana. This cantilevered steel through-truss bridge opened to traffic in 1935 and is owned and operated by the New Orleans Public Belt Railroad. The bridge currently carries dual rail lines between the trusses and two lanes of vehicular traffic cantilevered to the exterior of each truss. Based on the need to improve vehicular traffic flow and constraints due to uninterruptible rail traffic, the Louisiana Department of Transportation and Development (LA DOTD) decided to widen the bridge rather than replace it.
The bridge widening will facilitate an increase in roadway width on each side of the bridge from its current width of 18 ft to 40 ft. The widening will entail the addition of upstream and downstream trusses parallel to the existing truss. The bridge piers are being modified with additional concrete encasements and steel frame to support the two new widening trusses.
A structural health-monitoring program is included in the construction contract as a proactive measure to assess whether the anticipated amount of load is being transferred from the widening truss members to the existing truss members.
CTLGroup was awarded the contract to design and install the truss monitoring system according to the specifications for the Huey P. Long Bridge widening project. The truss monitoring specification required the following:
- Determination of initial deadload stresses in existing eyebar members
- Installation of strain gages for measurement of constructionrelated stresses in 433 members
- Installation of strain gages for measurement of live-load stresses in 31 members
- Installation of biaxial tilt meters on each of the five existing bridge piers
- Monitoring system to read the gages, make comparisons with predicted values, and provide daily reports throughout the three-year construction process
- Performing load testing to calibrate the monitoring systems
A total of 433 existing truss members are monitored with an array of 827 static and dynamic strain gages designed to measure axial and bending load effects. In addition, tilt meters monitor the inclination of the piers. For the static system, CTLGroup chose vibrating-wire strain gages based on cost, built-in temperature compensation, and the ability to run long distances with lead wires.
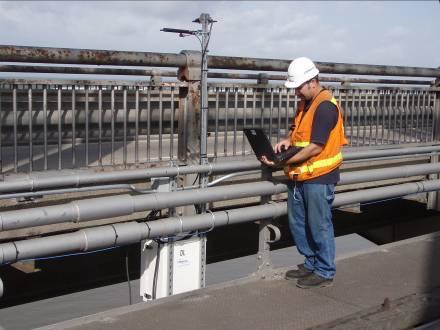
The truss-monitoring data-acquisition system is composed of two separate monitoring systems: a static-load monitoring system and a live-load monitoring system. The static system uses 23 track-side-mounted NEMA enclosures that contain AM16/32 multiplexers to read 777 vibrating-wire sensors on 433 members. In addition, five piers were monitored using ten vibrating-wire tilt meters as well as ambient temperature, wind speed, and wind direction. Because of the need for wireless communication between multiplexers, dataloggers, and the central computer, the system was configured using a combination of 24 AVW206 modules and RF401 spread-spectrum radios. The multiplexers read the sensors, perform the signal processing, and transmit the data wirelessly to one of four CR1000 dataloggers mounted on the track-side hand rail. These dataloggers then transmit the data wirelessly to the MTI office trailer approximately one-fourth mile from the bridge site.
The purpose of the system is to measure stresses (strains) in identified members and compare with predicted response during the bridge-widening construction process. This is accomplished by the following:
- Establishing limits for predicted response for staged construction
- Accounting for baseline fluctuations (traffic/locomotive loads and temperature effects)
- Comparing measured with predicted response
- Automated flagging of limits outside of predicted response
The system runs continuously and collects data approximately once every ten minutes. It posts the data to a password-protected website. The website visually flags (by color) data that are outside predetermined limits.
With hundreds of vibrating-wire sensors involved, this monitoring project provided an appropriate setting to apply the new spectral-analysis method. The outcome was very positive. Historically, an application with so many vibrating-wire measurements would require extra effort to validate measurements and identify noise-compromised data. Typically, some data would be lost due to noise interference. In this case, however, spectral analysis eliminated noise issues. No data were lost, and no extra effort was needed to identify noise-compromised data.
The diagnostics provided by the new method also proved to be beneficial, and were used extensively throughout the project. CTLGroup reported that troubleshooting issues could not have been as easily resolved without the AVW206. Though they have previously used time-domain solutions, this experience has put them solidly behind the spectral analysis method.
Resumen casos de aplicación
Aplicación
Monitoring bridge stresses during wideningUbicación
New Orleans, LouisianaProductos utilizados
AM16/32B CR1000Colaboradores
Tom Weinmann, CTLGroupEmpresas participantes
Louisiana Department of Transportation and Development (LA DOTD)Parámetros medidos
Dead-load stresses, construction-related stresses, tilt, air temperature, wind speed and directionVer el PDF