For ceilometers and visibility and present weather sensors


Resumen
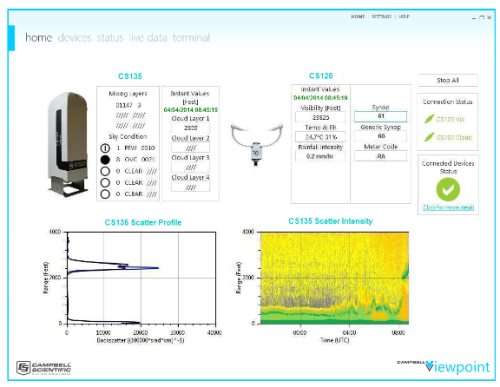
Viewpoint is data visualization software for the Campbell Scientific CS135 (SkyVUE™PRO) ceilometer, as well as the CS120A and CS125 visibility and present weather sensors. It allows the user to display data from one or more sensors in a clear and versatile manner and to log data in several widely used formats.
*Please note: the Campbell ceilometer range has been renamed. The CS135 is now the SkyVUE™PRO, and the CS136 is the SkyVUE™8. The old references remain in the software and on this page to ensure backwards compatibility.*
Various display charts are available and may be displayed individually or together. All charts are accompanied by a side panel with instantaneous values along with values dependent on sensor type. The scales on all axes can be configured. Units can be in feet or meters.
Viewpoint can create log files of sensor data. These can be in CSV, NetCDF Classic, or text format. Output rate, location, and content can be customized on a per-sensor basis. Viewpoint can read and display these log files for data visualization at a later time.
Three versions of Viewpoint are available:
- A basic version allowing use with a single sensor
- A mid-range version supporting up to 10 sensors for display only
- A full-featured version that supports up to 10 sensors for display and data logging
Ventajas y características
- Clear, simple, at a glance information on cloud, visibility and present weather parameters
- Configurable to match customer needs, shows what you need as you want to view it
- Data conveniently logged to standard formats
Imágenes


Descripción detallada
A Live Data screen shows the data messages being received. A Terminal screen allows direct control of a device and the ability to send commands manually.
An extensive operating guide and help feature are built in.
Three versions of Viewpoint are available. The basic version allows use with a single sensor. A multiple-sensor version allows use of up to 10 sensors. The third version combines multiple-sensor support with the ability to log data.
Campbell Viewpoint can be used for 100 hours in trial mode before it needs to be activated with a key purchased from Campbell Scientific.
Detailed CS135 (SkyVUE PRO) Chart Options
CS135 (SkyVUE™PRO) backscatter profile and scatter intensity charts display information on the scattering from different levels in the atmosphere. The Scatter Intensity plot shows the variation over time using a system of contours and color coding. Different colors represent different scatter intensities. The color thresholds are configurable so that, for example, a higher resolution at lower values can be set to show detail structure in aerosol scattering.
The cloud detection chart shows the height of detected cloud layers and/or vertical visibility over time. If the CS135 (SkyVUE™PRO) has the Mixing Layer Height (MLH) option activated, Viewpoint can display up to three layers. (MLH is an optional extra for the CS135 (SkyVUE™PRO) and will only be available when this feature is enabled. For more information on enabling this feature, please contact Campbell Scientific).
Sky condition is an assessment of cloud cover measured in units of eighths or "oktas." The number of oktas is the density of cloud in eighths of that layer. Up to five layers can be displayed.
Detailed CS120A and CS125 Chart Options
The visibility chart is available for both the CS120A and CS125. It shows the visibility as output from the sensors. Instantaneous values can also be seen in the accompanying side panel.
The temperature and relative humidity are available for the CS125 only. It shows the temperature and humidity being output from the sensor (if available). Instantaneous values can also be seen in the accompanying side panel.
The rainfall intensity chart is available for the CS125 only. It shows the reported rainfall intensity being output from the sensor. Instantaneous values can also be seen in the accompanying side panel.
The present weather chart is available for the CS125 only. It shows the current present weather code being output by the sensor. The various weather types are represented by colored bands, making it easy to see whether the current code falls within a particular weather classification.
Detailed Logging Options
Campbell Viewpoint allows data collected from the CS135 (SkyVUE™PRO), CS120A, or CS125 to be output to a file. It is possible to store data as NetCDF (Classic) or CSV. It is also possible to simply output a text file containing the raw output from the sensor.
When data is stored as NetCDF or CSV, the parameters that are saved are fully configurable.
CSV format contains the column headers in the first line of the file, with each record following on a new line.
Compatibilidad
Nota: lo siguiente muestra información de compatibilidad notable. No es una lista de todos los productos compatibles.
Sensores
| Producto | Compatible | Nota |
|---|---|---|
| CS125 | ||
| SkyVue 8 | ||
| SkyVue 8M (retired) | ||
| SkyVue PRO |
Miscelaneo
| Producto | Compatible | Nota |
|---|---|---|
| CS120A |
Información de compatibilidad adicional
Especificaciones
| -NOTE- | Viewpoint is not designed to be used over a remote desktop connection. |
| Minimum System Requirements |
|
| Data Logging |
|
| Hardware Communication Requirements | Campbell Viewpoint can connect to supported sensors either via direct serial connection or via serial over Ethernet. Multiple devices are supported on multi-drop connections if they are uniquely addressed and utilize the same connection settings. Up to 10 sensors can be used with multiple-sensor options of Viewpoint. |